Postoria Analytics: turn social media performance into your next content decision
Publishing is only half of a useful social media workflow. The other half is learning from the result.
September 2026 update: Postoria Analytics now also includes account-level analytics for connected social accounts. Read Introducing account-level social media analytics in Postoria for the new Accounts view. This article focuses on the Posts view.
The updated Postoria Analytics page gives you a clearer way to compare posts, follow performance over time, inspect the metrics returned for an individual post, and export the underlying data when you need a custom report.
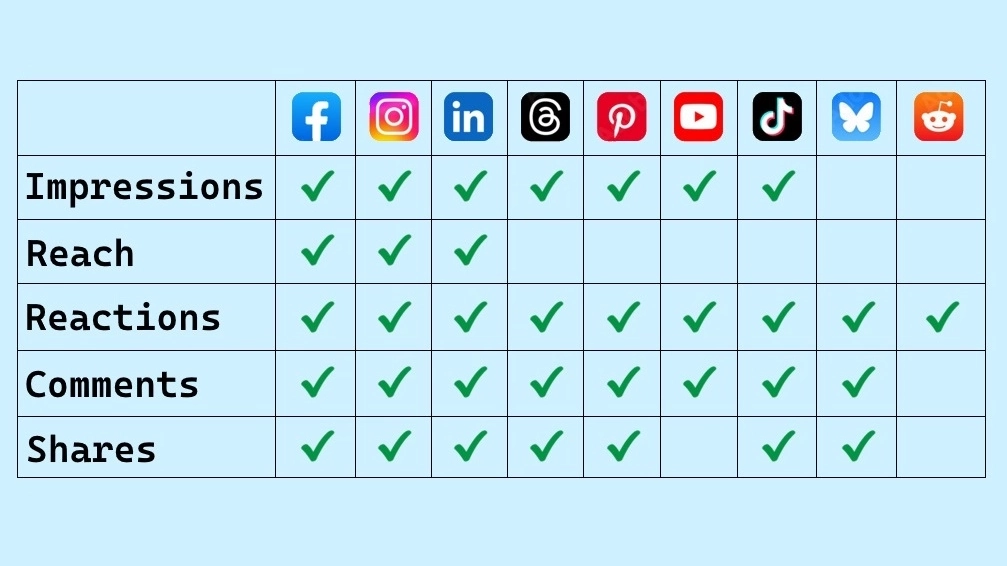
The Posts view covers posts published through Postoria. The exact metrics depend on the social network, account permissions, post format, and what the network makes available through its API.
What is new in Postoria Analytics
The Analytics page now brings several views of performance into one workflow:
- A post table for comparing published content
- Charts for supported metrics over time
- Hourly, daily, monthly, and yearly chart grouping when appropriate for the selected period
- Filters for workspaces, social networks, and accounts
- Detailed post analytics grouped by network or account
- Raw analytics export as a CSV file
- More network-specific engagement, click, profile, video, story, and reaction metrics
This makes the page useful for both a quick weekly review and a deeper analysis outside Postoria.
Compare published posts in one table
The default table view shows the posts in your current selection with their publication time and core performance metrics. Sort and scan the table to find posts that generated the most views, reach, reactions, comments, or shares.
Open a post from its title when you need to review the content itself. Use the Details action to inspect every metric Postoria received for that post.
The details drawer can group results in two ways:
- By network — useful when the same idea was published to several platforms
- By account — useful when you manage multiple brands, locations, or client accounts
Follow performance over time with charts
Switch to Charts to see how available metrics changed throughout the selected period. Depending on the length of the period, you can group results by:
- Hour
- Day
- Month
- Year
Use shorter periods and hourly or daily grouping to review a recent campaign. Use monthly or yearly grouping for longer-term trends.
Filter the data that matters
Analytics can be filtered by:
- Period — last 7 days, last 4 weeks, last 3 months, last 12 months, month to date, quarter to date, year to date, or all time
- Workspace — compare one brand or combine all workspaces you can access
- Network — focus on one or more social platforms
- Account — narrow the result to specific connected accounts
An empty workspace, network, or account selection means all available items in that filter. This is useful when you want an overall view without selecting every item individually.
Explore the metrics each network provides
Postoria normalizes common metrics where that comparison is meaningful, then preserves more specific metrics for detailed analysis.
Core visibility and engagement
Depending on the network, you may see:
- Views and reach
- Reactions, likes, comments, and shares
- Replies, reposts, quotes, and external shares
- Saves, sends, and total interactions
Click and profile activity
Supported accounts and post types may also provide:
- Clicks, link clicks, outbound clicks, and pin clicks
- Photo views and other clicks
- Profile views and profile activity
- Bio link, call, direction, email, and text-message clicks
- Follows and premium call-to-action clicks
Video, story, and reaction details
For compatible content, Postoria can show metrics such as:
- Video views, plays, unique viewers, and watch time
- Average video watch time and video skip rate in post details
- Story exits, taps back, taps forward, and swipes forward
- Facebook reaction breakdowns such as Like, Love, Care, Haha, Wow, Sad, and Angry
Metric names are not interchangeable across every network. For example, a view, play, impression, and reach can have different definitions. Use the metrics a network actually returns and compare like with like whenever possible.
YouTube analytics
YouTube publications can include separate metrics for views and engaged views, likes and dislikes, comments, shares, playlist activity, watch time, annotations, cards, and subscriber changes. Average view duration, average view percentage, and rate metrics stay in post details and raw exports instead of being added together in aggregate charts.
These values retain YouTube-specific names and are displayed separately from Postoria and other-platform metrics.
Export raw analytics to CSV
Use Download CSV when you need the underlying post-and-account rows outside Postoria. The export is useful for:
- Client reporting
- Spreadsheet analysis
- Custom charts and dashboards
- Campaign archives
- Combining social results with website or sales data
The CSV follows the same period, workspace, network, and account filters currently selected on the Analytics page.
Turn the numbers into decisions
Analytics becomes useful when it changes what you publish next. A simple review can answer questions such as:
- Which topics consistently earn attention?
- Which formats generate saves, shares, or longer watch time?
- Does the same idea behave differently by network or account?
- Which calls to action generate link or profile activity?
- Are recent results improving, stable, or declining?
Avoid judging a post from one number alone. A high-view post may produce little action, while a lower-reach post may earn more saves, replies, or clicks. Start with the goal of the post, then choose the metrics that reflect that goal.
Important coverage and freshness notes
- The Posts view covers posts published through Postoria; the Accounts view separately reports supported metrics for connected accounts.
- Available metrics vary by network, account type, permissions, and content type.
- Some metrics appear later than others because networks refresh them on different schedules.
- A value may be unavailable even when another metric exists for the same post.
- Native apps and APIs can refresh or define metrics differently, so temporary differences may occur.
- Postoria does not provide competitor analytics.
If expected data is missing, confirm that the account is still connected and has the permissions required by its network.
Start using Analytics
- Connect your social accounts.
- Publish content through Postoria.
- Open Analytics from the Postoria navigation.
- Choose a period and apply any workspace, network, or account filters.
- Compare posts in the table or switch to charts.
- Open Details for a post or download the raw CSV when you need a deeper review.
For the complete step-by-step workflow across Posts and Accounts, read How to use Analytics in Postoria. For a concise product overview, visit the Social Media Analytics feature page.
Tag:
product updates